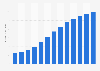
Between 2009 and 2018, the gaming industry saw a reduction of over 4,000 slot machines or ''pokies'' across New Zealand, with the number of gaming machines in venues in the country sitting at just over 15.3 thousand as of 2018.
Number of gaming machines in New Zealand from 2009 to 2018 (in 1,000s)
Basic Account
Get to know the platform
You only have access to basic statistics.
This statistic is not included in your account.
Starter Account
The ideal entry-level account for individual users
- Instant access to 1m statistics
- Download in XLS, PDF & PNG format
- Detailed references
$199 USD / Month *
Professional Account
Full access
Business Solutions including all features.
* Prices do not include sales tax.
Other statistics that may interest you Statistics on
About the industry
10
- Premium Statistic Gaming machine spending New Zealand FY 2011-2018
- Premium Statistic Gambling spending New Zealand FY 2018 by activity
- Premium Statistic Gambling spending New Zealand FY 2011-2018
- Basic Statistic Americans' moral stance towards gambling in 2018
- Premium Statistic Slot machine manufacturers: market share U.S.& Canada Q2 2016
- Premium Statistic Premium slot machine manufacturers: market share U.S.& Canada Q2 2016
- Premium Statistic Number of venues with gaming machines in Australia as of June 30, 2020
- Premium Statistic Casinos in Australia as of June 30, 2020, by state and territory
- Premium Statistic Number of gaming machines operating in Australia 2011-2020
- Premium Statistic Government revenue from gambling in Australia FY2010-2020
About the region
9
- Premium Statistic Racing and sports betting spending New Zealand FY 2011-2018
- Premium Statistic Lottery spending New Zealand FY 2011-2018
- Premium Statistic Casino gambling spending New Zealand FY 2011-2018
- Premium Statistic Gambling activities industry employees New Zealand 2018 by region
- Premium Statistic Gaming machine numbers in New Zealand 2009-2019
- Premium Statistic Total gaming machine proceeds in New Zealand by venue type 2019
- Premium Statistic Gaming machine proceeds in New Zealand by area 2019
- Premium Statistic Number of gaming machines in New Zealand by venue 2019
- Premium Statistic Average gaming machine proceeds in New Zealand by venue type 2019
Selected statistics
2
Other regions
10
- Premium Statistic Casino gaming amount won from gambling in Nevada in the U.S. 2000-2022
- Premium Statistic Casino visits in Netherlands 2013-2017
- Basic Statistic Lottery-related activities among men in England in 2012, by age
- Premium Statistic Revenue of casino gaming in Finland from 2009 to 2015
- Premium Statistic Casino visits in Spain from 2010 to 2017
- Premium Statistic Germany: number of casinos 2013-2017
- Premium Statistic France: number of casinos 2013-2017
- Premium Statistic Casino visits in Poland from 2010 to 2017
- Premium Statistic Casino visits in Switzerland from 2010 to 2017
- Premium Statistic Casino visits in Austria 2013-2017
Related statistics
10
- Premium Statistic Per capita gambling expenditure in Australia FY2010-2020
- Premium Statistic Gambling frequency before and during the coronavirus pandemic in Australia 2020
- Premium Statistic Monthly gambling expenditure before and during COVID-19 in Australia 2020, by gender
- Premium Statistic Share of gambling before and during COVID-19 in Australia 2020, by location
- Premium Statistic Monthly net gambling revenue of gaming machines Australia 2016
- Premium Statistic Casino gaming: revenue in Australia 2015
- Premium Statistic Per capita gambling expenditure New South Wales, Australia FY 2020, by type
- Premium Statistic Per capita gaming expenditure Australia FY 2020, by state
- Premium Statistic Total gaming turnover Australia FY 2020, by type
- Premium Statistic Per capita gambling expenditure Australia FY 2020, by type
Further Content: You might find this interesting as well
Statistics
New Zealand Community Trust. (January 25, 2019). Number of gaming machines in New Zealand from 2009 to 2018 (in 1,000s) [Graph]. In Statista. Retrieved May 09, 2024, from https://www.statista.com/statistics/1032588/new-zealand-slot-machine-numbers/
New Zealand Community Trust. "Number of gaming machines in New Zealand from 2009 to 2018 (in 1,000s)." Chart. January 25, 2019. Statista. Accessed May 09, 2024. https://www.statista.com/statistics/1032588/new-zealand-slot-machine-numbers/
New Zealand Community Trust. (2019). Number of gaming machines in New Zealand from 2009 to 2018 (in 1,000s). Statista. Statista Inc.. Accessed: May 09, 2024. https://www.statista.com/statistics/1032588/new-zealand-slot-machine-numbers/
New Zealand Community Trust. "Number of Gaming Machines in New Zealand from 2009 to 2018 (in 1,000s)." Statista, Statista Inc., 25 Jan 2019, https://www.statista.com/statistics/1032588/new-zealand-slot-machine-numbers/
New Zealand Community Trust, Number of gaming machines in New Zealand from 2009 to 2018 (in 1,000s) Statista, https://www.statista.com/statistics/1032588/new-zealand-slot-machine-numbers/ (last visited May 09, 2024)
Number of gaming machines in New Zealand from 2009 to 2018 (in 1,000s) [Graph], New Zealand Community Trust, January 25, 2019. [Online]. Available: https://www.statista.com/statistics/1032588/new-zealand-slot-machine-numbers/