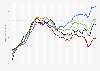
In 2020, the shipment index of durable consumer goods for domestic uses in Japan reached 93.1 points, reaching an eight year-low. The highest shipment index within the surveyed period was recorded in 2013, when it stood at 11.7 index points above the base year 2015.
Domestic shipment index of durable consumer goods in Japan from 2013 to 2020
Basic Account
Get to know the platform
You only have access to basic statistics.
This statistic is not included in your account.
Starter Account
The ideal entry-level account for individual users
- Instant access to 1m statistics
- Download in XLS, PDF & PNG format
- Detailed references
$199 USD / Month *
Professional Account
Full access
Business Solutions including all features.
* Prices do not include sales tax.
Other statistics that may interest you Statistics on
About the industry
10
- Premium Statistic Nondurable consumer goods domestic shipment index in Japan 2013-2022
- Premium Statistic Nondurable consumer goods export index in Japan 2013-2022
- Premium Statistic Most popular FMCG brands in Hungary 2022
- Premium Statistic Sales volume of consumer goods in France 2023-2024, by product category
- Premium Statistic Sales value of consumer goods in France 2023-2024, by product category
- Premium Statistic Growth of FMCG in India Q1 2019-Q3 2023
- Premium Statistic Most popular FMCG brands' household penetration in Taiwan 2022
- Premium Statistic Most popular FMCG brands' household reach in China 2022
- Premium Statistic Most popular FMCG brands' household penetration in China 2022
- Premium Statistic FMCG brand preferences Philippines 2022, by consumer reach points
About the region
10
- Premium Statistic Bicycle goods market size in Japan 2015-2024
- Premium Statistic Domestic cosmetics market share in Japan FY 2022, by category
- Premium Statistic Sports shoes market size in Japan 2015-2024
- Premium Statistic Swimming goods market size in Japan 2015-2024
- Premium Statistic Baseball and softball goods market size in Japan 2015-2024
- Premium Statistic Martial arts goods market size in Japan 2015-2024
- Premium Statistic Ski goods market size in Japan 2015-2024
- Premium Statistic Table tennis goods market size in Japan 2015-2024
- Premium Statistic Sporting goods market size in Japan 2023, by category
- Premium Statistic Soccer and futsal goods market size in Japan 2015-2024
Selected statistics
2
Other regions
10
- Premium Statistic Universal Robina Corporation sales of goods and services FY 2017-FY 2022
- Premium Statistic Production volume of fruit and vegetable juices in North Macedonia 2017, by type
- Premium Statistic Production volume of fruit and vegetable juices in Romania 2017, by type
- Premium Statistic Production volume of fruit and vegetable juices in Lithuania 2017, by type
- Premium Statistic Production volume of fruit and vegetable juices in Slovakia 2017, by type
- Premium Statistic Production volume of fruit and vegetable juices in Hungary 2017, by type
- Premium Statistic Production volume of fruit and vegetable juices in Norway 2017, by type
- Premium Statistic Production volume of fruit and vegetable juices in Bosnia-Herzegovina 2017, by type
- Premium Statistic Production volume of fruit and vegetable juices in Belgium 2017, by type
- Premium Statistic Production volume of fruit and vegetable juices in Portugal 2017, by type
Related statistics
10
- Premium Statistic Outdoor goods market size in Japan 2015-2024
- Premium Statistic Household expenditure on nondurable consumer goods in Japan 2013-2022
- Premium Statistic Fitness gear market size in Japan 2011-2019
- Premium Statistic Expectations of consumer goods price development in Japan 2023
- Premium Statistic Retail sales value of chocolate in Japan 2013-2022
- Premium Statistic CPI of nondurable consumer goods in Japan 2013-2022
- Premium Statistic Ready to drink blended tea production volume in Japan 2013-2021
- Premium Statistic Infant goods and services market size in Japan 2014-2024
- Premium Statistic Ski wear market domestic shipment value in Japan 2018-2023
- Premium Statistic Gardening market shipment value in Japan FY 2018-2027
Further related statistics
10
- Sales share of L'Oréal's global cosmetic branch 2023, by business segment
- Sales share of L'Oréal's global cosmetic branch 2023, by geographic zone
- Mondelez International's net revenue distribution worldwide by sector 2022
- Mondelez International's operating income worldwide 2011-2022
- Mondelez International's global workforce by region 2012-2022
- Walgreens gross profit and net earnings in the U.S. 2005-2023
- Net sales of ConAgra Brands worldwide 2012-2023
- Net sales of ConAgra Brands worldwide 2015-2023, by segment
- Value of global chemical shipments 2001-2022
- Consolidated sales of L'Oréal worldwide 2012-2021, by branch
Further Content: You might find this interesting as well
Statistics
- Sales share of L'Oréal's global cosmetic branch 2023, by business segment
- Sales share of L'Oréal's global cosmetic branch 2023, by geographic zone
- Mondelez International's net revenue distribution worldwide by sector 2022
- Mondelez International's operating income worldwide 2011-2022
- Mondelez International's global workforce by region 2012-2022
- Walgreens gross profit and net earnings in the U.S. 2005-2023
- Net sales of ConAgra Brands worldwide 2012-2023
- Net sales of ConAgra Brands worldwide 2015-2023, by segment
- Value of global chemical shipments 2001-2022
- Consolidated sales of L'Oréal worldwide 2012-2021, by branch
METI (Japan). (March 8, 2021). Domestic shipment index of durable consumer goods in Japan from 2013 to 2020 [Graph]. In Statista. Retrieved May 16, 2024, from https://www.statista.com/statistics/1224673/japan-durable-consumer-goods-domestic-shipment-index/
METI (Japan). "Domestic shipment index of durable consumer goods in Japan from 2013 to 2020." Chart. March 8, 2021. Statista. Accessed May 16, 2024. https://www.statista.com/statistics/1224673/japan-durable-consumer-goods-domestic-shipment-index/
METI (Japan). (2021). Domestic shipment index of durable consumer goods in Japan from 2013 to 2020. Statista. Statista Inc.. Accessed: May 16, 2024. https://www.statista.com/statistics/1224673/japan-durable-consumer-goods-domestic-shipment-index/
METI (Japan). "Domestic Shipment Index of Durable Consumer Goods in Japan from 2013 to 2020." Statista, Statista Inc., 8 Mar 2021, https://www.statista.com/statistics/1224673/japan-durable-consumer-goods-domestic-shipment-index/
METI (Japan), Domestic shipment index of durable consumer goods in Japan from 2013 to 2020 Statista, https://www.statista.com/statistics/1224673/japan-durable-consumer-goods-domestic-shipment-index/ (last visited May 16, 2024)
Domestic shipment index of durable consumer goods in Japan from 2013 to 2020 [Graph], METI (Japan), March 8, 2021. [Online]. Available: https://www.statista.com/statistics/1224673/japan-durable-consumer-goods-domestic-shipment-index/