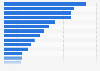
The statistic depicts how many hours employees work per week on average worldwide. Respondents from India work 42 hours per week on average.
How many hours per week do you typically work?
Loading statistic...
Basic Account
Get to know the platform
You only have access to basic statistics.
Starter Account
The ideal entry-level account for individual users
- Instant access to 1m statistics
- Download in XLS, PDF & PNG format
- Detailed references
$199 USD / Month *
Professional Account
Full access
Business Solutions including all features.
* Prices do not include sales tax.
Other statistics that may interest you Statistics on
About the industry
10
- Basic Statistic Travel companions of employees worldwide 2011
- Premium Statistic Average length of stay on visits abroad from the UK 2019-2022, by purpose
- Premium Statistic Home countries of tourists in Germany 2021-2022
- Basic Statistic Global travel and tourism expenditure 2019-2022, by type
- Basic Statistic Change of travel and tourism industry's contribution to GDP in China 2012-2023
- Basic Statistic Contribution of China's travel and tourism industry to GDP 2014-2023
- Premium Statistic Trips of Italian outbound tourists 2019-2021, by accommodation type
- Basic Statistic Visitor arrivals in Helsinki 2022, by country of origin
- Premium Statistic Duration of trips taken by residents of France 2015-2020, by destination type
- Premium Statistic Number of wellness tourism trips worldwide 2019-2022, by region
About the region
10
- Basic Statistic COVID-19: job loss in travel and tourism worldwide 2020-2022, by country
- Basic Statistic COVID-19: job loss in travel and tourism worldwide 2020-2022, by region
- Basic Statistic Keller Group PLC: number of employees 2019
- Basic Statistic Most important employment factors when choosing jobs worldwide 2014
- Basic Statistic Preference for social media as a job-search tool worldwide 2012-2014, by region
- Basic Statistic Use of social media network for career decisions worldwide 2012-2014, by region
- Basic Statistic Appropriateness of using social media for personal reasons at work by generation
- Basic Statistic Appropriateness of using social media for personal use at work 2012, by region
- Basic Statistic Opinion on searching for jobs via social media than traditional methods 2012
- Basic Statistic Job searches via social media versus traditional methods 2012, by industry
Selected statistics
7
- Premium Statistic Number of visitors to the U.S. from Russia 2011-2022
- Premium Statistic Number of international tourist arrivals APAC 2019, by country or region
- Premium Statistic Middle Eastern countries with the largest international tourism receipts 2018
- Premium Statistic Music tourist spending at concerts and festivals in the United Kingdom (UK) 2012-2016
- Premium Statistic Camping expenditures for food, beverages and entertainment in North America 2014
- Basic Statistic Importance of BRICS countries to UK tourism businesses 2011
- Basic Statistic Familiarity with the BP/Deepwater Horizon oil spill in the U.S. 2010
Other regions
10
- Basic Statistic Average number of employees and self-employed in Poland 2003-2023
- Basic Statistic Number of real estate employees in France 2014-2023, per quarter
- Premium Statistic Direct employment in the mobile industry in MENA by segment 2015
- Premium Statistic Ratio jobs-work force in the Netherlands 2018, by province
- Premium Statistic Annual wage growth in the private sector in Tunisia 2014-2018
- Premium Statistic Number of employees at China Tourism Group Duty Free 2013-2023
- Basic Statistic Average full-time hourly wage in the UK 2023, by region
- Premium Statistic Energy sector employment in Canada 2011-2022
- Premium Statistic Industries with the highest number of foreign employees in Sweden 2021
- Basic Statistic Labor cost index in the construction industry in Finland 2012-2022
Related statistics
10
- Basic Statistic Employment in library and archive activities in the United Kingdom (UK) 2011-2020
- Basic Statistic Support activities to performing arts employment in the United Kingdom (UK) 2011-2020
- Basic Statistic Employment in operation of arts facilities in the United Kingdom 2011-2019
- Premium Statistic Average age of travelers on RĂ©union 2016-2017
- Premium Statistic Number of artists in the civilian workforce in the U.S. 1999-2013
- Premium Statistic Employees in creative industries in the U.S. 2003-2013
- Premium Statistic Number of arrivals in accommodation establishments in Milan 2014-2022
- Premium Statistic Inbound and outbound travel spending in Italy 2010-2022
- Premium Statistic Outbound tourism expenditure in the UK 2007-2022
- Premium Statistic Number of outbound overnight stays by UK residents 2011-2022
Further related statistics
9
- Importance of management's recognition to job satisfaction of U.S. employees 2015
- U.S. employees - satisfaction with career development opportunities 2012
- U.S. employees - importance of job security 2012
- U.S. employees - engagement behaviors in the workplace 2012
- U.S. employees - satisfaction with independence and autonomy at workplace 2012
- Annual revenue of China Tourism Group Duty Free 2013-2023
- Biofuels related jobs worldwide by region 2019
- Number of employees in the U.S. offices of real estate agents and brokers 2010-2016
- John Lewis Partnership: number of employees in the United Kingdom (UK) 2009-2023
Further Content: You might find this interesting as well
Statistics
- Importance of management's recognition to job satisfaction of U.S. employees 2015
- U.S. employees - satisfaction with career development opportunities 2012
- U.S. employees - importance of job security 2012
- U.S. employees - engagement behaviors in the workplace 2012
- U.S. employees - satisfaction with independence and autonomy at workplace 2012
- Annual revenue of China Tourism Group Duty Free 2013-2023
- Biofuels related jobs worldwide by region 2019
- Number of employees in the U.S. offices of real estate agents and brokers 2010-2016
- John Lewis Partnership: number of employees in the United Kingdom (UK) 2009-2023
Expedia. (November 30, 2011). How many hours per week do you typically work? [Graph]. In Statista. Retrieved May 23, 2024, from https://www.statista.com/statistics/244221/average-working-hours-per-week/
Expedia. "How many hours per week do you typically work?." Chart. November 30, 2011. Statista. Accessed May 23, 2024. https://www.statista.com/statistics/244221/average-working-hours-per-week/
Expedia. (2011). How many hours per week do you typically work?. Statista. Statista Inc.. Accessed: May 23, 2024. https://www.statista.com/statistics/244221/average-working-hours-per-week/
Expedia. "How Many Hours per Week Do You Typically Work?." Statista, Statista Inc., 30 Nov 2011, https://www.statista.com/statistics/244221/average-working-hours-per-week/
Expedia, How many hours per week do you typically work? Statista, https://www.statista.com/statistics/244221/average-working-hours-per-week/ (last visited May 23, 2024)
How many hours per week do you typically work? [Graph], Expedia, November 30, 2011. [Online]. Available: https://www.statista.com/statistics/244221/average-working-hours-per-week/