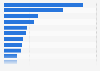
The statistic shows the results of an online survey conducted among 939 Hispanic internet users in the United States in November 2013. The survey respondents, who were 18 years and older and shop for groceries, were polled about their attitudes towards dairy products, based on the language they speak in their home. Some 54 percent of Spanish-speaking Hispanic consumers wish that more stores carried dairy products that are popular in their home culture.
Hispanics' attitudes toward dairy products, by languages spoken in home in the United States as of November 2013
Basic Account
Get to know the platform
You only have access to basic statistics.
This statistic is not included in your account.
Starter Account
The ideal entry-level account for individual users
- Instant access to 1m statistics
- Download in XLS, PDF & PNG format
- Detailed references
$199 USD / Month *
Professional Account
Full access
Business Solutions including all features.
* Prices do not include sales tax.
Other statistics that may interest you Statistics on
About the industry
10
- Premium Statistic Russia: food and agricultural import volume growth 2020, by product
- Premium Statistic Natural and organic refrigerated food sales value in the U.S. 2017, by category
- Premium Statistic Production volume of goat cheese in France 2008-2022
- Premium Statistic Weekly consumption of processed cheese in the United Kingdom (UK) 2006-2019
- Premium Statistic Italy: year-on-year change in household spending on food 2017, by product
- Premium Statistic Chilled and fresh food sales value in Germany 2016, by category
- Premium Statistic Chilled and fresh food sales value in the Netherlands 2016, by category
- Premium Statistic Value of U.S. dairy imports from Europe 2005-2022
- Premium Statistic Value of U.S. dairy exports to Africa 2005-2022
- Premium Statistic Revenue of Bright Dairy & Food 2012-2022
About the region
10
- Premium Statistic U.S. dairy department sales 2017-2022
- Premium Statistic Average household expenditure per trip on dairy foods in the United States 2022
- Premium Statistic Dairy dollar sales U.S. by product category 2021
- Premium Statistic Dairy processing equipment market value in the U.S. 2014-2025, by type
- Premium Statistic Spanish-language TV consumption among Latinx viewers in the U.S. 2023
- Basic Statistic U.S. per capita consumption of dairy products 2022, by type
- Basic Statistic Most Latin Grammy Award-winning individuals of all time
- Premium Statistic Amount of Temptee cream cheese eaten in the last 30 days in the U.S. 2020
- Premium Statistic Amount of Kraft Shredded grated cheese eaten in the last 7 days in the U.S. 2020
- Premium Statistic Amount of Borden cream cheese eaten in the last 7 days in the U.S. 2020
Selected statistics
1
Other regions
10
- Premium Statistic Average prices for dairy and fat products in Poland 2024
- Premium Statistic Sales value of dairy products in France 2014-2021, by category
- Premium Statistic Monthly manufacturer sales of dairy products in Canada 2019-2023
- Premium Statistic Dairy production in the Netherlands 2014-2021, by type of product
- Premium Statistic Share of milk used for dairy production in Denmark 2021, by product category
- Premium Statistic Chile: dairy import volume 2018, by country
- Premium Statistic Distribution of the global dairy market volume in 2017, by category
- Premium Statistic Leading Danone products in Great Britain 2022, by number of consumers
- Premium Statistic Brazil: per capita consumption of dairy products 2016-2021
- Premium Statistic Market value of the dairy industry in India FY 2017, by segment
Related statistics
10
- Premium Statistic Production volume of blue vein cheeses United Kingdom (UK) 2000-2022
- Premium Statistic Production volume of other cheeses including mozzarella United Kingdom (UK) 2000-2022
- Basic Statistic Weekly consumption of cottage cheese in the United Kingdom (UK) 2006-2021/2022
- Premium Statistic Production volume of cheddar cheese in the United Kingdom (UK) 2000-2021
- Premium Statistic Production volume of long life territorial cheeses United Kingdom (UK) 2000-2021
- Premium Statistic Production volume of short life territorial cheeses United Kingdom (UK) 2000-2021
- Premium Statistic Weekly consumption of soft natural cheese in the United Kingdom (UK) 2006-2021/2022
- Premium Statistic Cheddar cheese sales volume in Great Britain 2012-2017, by private label/brand
- Premium Statistic Cheddar cheese average retail price in Great Britain 2009-2017
- Premium Statistic Sales volume of cheddar cheese market in the United Kingdom (UK) 2016
Further related statistics
9
- Mondelez International's global workforce by region 2012-2022
- Mondelez International's net revenue distribution worldwide by sector 2022
- Mondelez International's operating income worldwide 2011-2022
- Danone worldwide: essential and plant based dairy products' net sales 2018-2021
- Frequency of buying a ‘meal deal’ from the supermarket in Great Britain 2013
- U.S. cell phone owners who use mobile banking 2013, by ethnicity
- Vending machines: sales volume of vended products 2010
- Largest Colombian-American population groups in the U.S., by county 2010
- Largest Honduran-American population groups in the U.S., by county 2010
Further Content: You might find this interesting as well
Statistics
- Mondelez International's global workforce by region 2012-2022
- Mondelez International's net revenue distribution worldwide by sector 2022
- Mondelez International's operating income worldwide 2011-2022
- Danone worldwide: essential and plant based dairy products' net sales 2018-2021
- Frequency of buying a ‘meal deal’ from the supermarket in Great Britain 2013
- U.S. cell phone owners who use mobile banking 2013, by ethnicity
- Vending machines: sales volume of vended products 2010
- Largest Colombian-American population groups in the U.S., by county 2010
- Largest Honduran-American population groups in the U.S., by county 2010
AAAA. (February 15, 2014). Hispanics' attitudes toward dairy products, by languages spoken in home in the United States as of November 2013 [Graph]. In Statista. Retrieved May 03, 2024, from https://www.statista.com/statistics/315845/us-hispanics-attitudes-towards-dairy-products/
AAAA. "Hispanics' attitudes toward dairy products, by languages spoken in home in the United States as of November 2013." Chart. February 15, 2014. Statista. Accessed May 03, 2024. https://www.statista.com/statistics/315845/us-hispanics-attitudes-towards-dairy-products/
AAAA. (2014). Hispanics' attitudes toward dairy products, by languages spoken in home in the United States as of November 2013. Statista. Statista Inc.. Accessed: May 03, 2024. https://www.statista.com/statistics/315845/us-hispanics-attitudes-towards-dairy-products/
AAAA. "Hispanics' Attitudes toward Dairy Products, by Languages Spoken in Home in The United States as of November 2013." Statista, Statista Inc., 15 Feb 2014, https://www.statista.com/statistics/315845/us-hispanics-attitudes-towards-dairy-products/
AAAA, Hispanics' attitudes toward dairy products, by languages spoken in home in the United States as of November 2013 Statista, https://www.statista.com/statistics/315845/us-hispanics-attitudes-towards-dairy-products/ (last visited May 03, 2024)
Hispanics' attitudes toward dairy products, by languages spoken in home in the United States as of November 2013 [Graph], AAAA, February 15, 2014. [Online]. Available: https://www.statista.com/statistics/315845/us-hispanics-attitudes-towards-dairy-products/