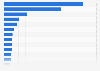
This statistic depicts the average revenue per user (ARPU) in the Middle East and Africa from 2012 to 2017, by social media platform. It has been forecasted, that the average revenue generated per Facebook user in the Middle East and Africa in 2017 will be about four U.S. dollars.
Average revenue per user in the Middle East and Africa from 2012 to 2017, by social media platform (in U.S. dollars)
Basic Account
Get to know the platform
You only have access to basic statistics.
This statistic is not included in your account.
Starter Account
The ideal entry-level account for individual users
- Instant access to 1m statistics
- Download in XLS, PDF & PNG format
- Detailed references
$199 USD / Month *
Professional Account
Full access
Business Solutions including all features.
* Prices do not include sales tax.
Other statistics that may interest you Statistics on
About the industry
10
- Basic Statistic Leading social networks in Sweden 2023, by share of visits
- Premium Statistic Daily TikTok access frequency in Poland 2022
- Premium Statistic Frequency of posting video content on TikTok in Poland 2022
- Premium Statistic Favorite content categories for TikTok creators in Poland 2022
- Premium Statistic Share of social media users in Finland 2022, by platform and frequency
- Premium Statistic Favorite content categories for TikTok viewers in Poland 2022
- Basic Statistic Leading social networks ranked by usage in the United Kingdom (UK) 2018
- Basic Statistic Penetration of social networks in the United Kingdom (UK) 2018, by gender
- Basic Statistic Penetration of social networks in the United Kingdom (UK) 2018, by social grade
- Basic Statistic Penetration of social networks in the United Kingdom (UK) 2018, by geographic area
About the region
10
- Premium Statistic Share of users who cannot live without social media in MENA by country 2016
- Basic Statistic Arab Facebook penetration 2014
- Basic Statistic Most popular social media in Arab countries 2014
- Basic Statistic Social media usage activities in Arab countries 2014
- Premium Statistic Facebook: age distribtion of MENA audiences 2014
- Premium Statistic Facebook: gender distribtion of MENA audiences 2014
- Premium Statistic Facebook subscribers in West African countries 2022
- Premium Statistic Share of leading social media for news in UAE by platform 2017
- Premium Statistic Active mobile social media penetration in MENA countries 2017
- Basic Statistic Arab WhatsApp penetration 2014
Selected statistics
2
Other regions
10
- Basic Statistic Monthly market share of Facebook in Finland 2023-2024
- Premium Statistic Use of a chatbot to contact a brand in France 2018
- Premium Statistic Facebook users in Flanders (Belgium) 2017-2019, by age
- Premium Statistic Latin America & the Caribbean: mobile social media users by region 2019
- Premium Statistic Most popular social media platforms to buy products and services in Hong Kong 2018
- Basic Statistic Nicaragua: share of Facebook users 2018, by gender
- Basic Statistic Guatemala: share of Facebook users 2018, by gender
- Basic Statistic Ecuador: share of Facebook users 2018, by gender
- Premium Statistic Time spent using social networks per person in Germany in December 2017, by platform
- Basic Statistic Social networking penetration in Great Britain 2011-2020
Related statistics
10
- Premium Statistic Number of LinkedIn users in MENA by country 2017
- Premium Statistic Distribution of LinkedIn users in MENA by by country 2017
- Premium Statistic Share of daily active Facebook user in the GCC by by country 2017
- Premium Statistic LinkedIn users gender distribution in MENA by country 2017
- Premium Statistic LinkedIn users age distribution in MENA by country 2017
- Premium Statistic Facebook penetration rate in MENA by country 2017
- Premium Statistic Share of top country hashtags from MENA by country 2016
- Premium Statistic Change in Facebook user number in MENA by country 2014-2017
- Premium Statistic Facebook: online reach in Saudi Arabia 2022-2028
- Premium Statistic Instagram usage in MENA by language 2016
Further Content: You might find this interesting as well
Statistics
Nakono. (March 7, 2013). Average revenue per user in the Middle East and Africa from 2012 to 2017, by social media platform (in U.S. dollars) [Graph]. In Statista. Retrieved May 11, 2024, from https://www.statista.com/statistics/717917/middle-east-and-africa-arpu-by-social-media-platform/
Nakono. "Average revenue per user in the Middle East and Africa from 2012 to 2017, by social media platform (in U.S. dollars)." Chart. March 7, 2013. Statista. Accessed May 11, 2024. https://www.statista.com/statistics/717917/middle-east-and-africa-arpu-by-social-media-platform/
Nakono. (2013). Average revenue per user in the Middle East and Africa from 2012 to 2017, by social media platform (in U.S. dollars). Statista. Statista Inc.. Accessed: May 11, 2024. https://www.statista.com/statistics/717917/middle-east-and-africa-arpu-by-social-media-platform/
Nakono. "Average Revenue per User in The Middle East and Africa from 2012 to 2017, by Social Media Platform (in U.S. Dollars)." Statista, Statista Inc., 7 Mar 2013, https://www.statista.com/statistics/717917/middle-east-and-africa-arpu-by-social-media-platform/
Nakono, Average revenue per user in the Middle East and Africa from 2012 to 2017, by social media platform (in U.S. dollars) Statista, https://www.statista.com/statistics/717917/middle-east-and-africa-arpu-by-social-media-platform/ (last visited May 11, 2024)
Average revenue per user in the Middle East and Africa from 2012 to 2017, by social media platform (in U.S. dollars) [Graph], Nakono, March 7, 2013. [Online]. Available: https://www.statista.com/statistics/717917/middle-east-and-africa-arpu-by-social-media-platform/