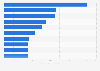
This statistic displays the small hydropower capacity in Italy from 2013 to 2016. According to data, the total capacity increased slightly during this period, reaching 3,299 megawatts as of 2016.
Small hydropower net capacity in Italy from 2013 to 2016 (in megawatts)
Basic Account
Get to know the platform
You only have access to basic statistics.
This statistic is not included in your account.
Starter Account
The ideal entry-level account for individual users
- Instant access to 1m statistics
- Download in XLS, PDF & PNG format
- Detailed references
$199 USD / Month *
Professional Account
Full access
Business Solutions including all features.
* Prices do not include sales tax.
Other statistics that may interest you Statistics on
About the industry
10
- Premium Statistic Small hydropower gross electricity production in Greece 2013-2016
- Premium Statistic Small hydropower net capacity in France from 2013-2016
- Premium Statistic Small hydropower net capacity in Germany from 2013-2016
- Premium Statistic Solar thermal surfaces installed in Poland 2015-2022
- Premium Statistic Generation capacity of solar energy Japan 2014-2023
- Premium Statistic Wind power capacity by companies in the European Union (EU-27) in 2022
- Premium Statistic Hydroelectricity generation Spain 2010-2023
- Premium Statistic Pumped-storage hydroelectricity generation Spain 2010-2023
- Premium Statistic Direct uses of geothermal energy in France from 2013 to 2020
- Basic Statistic Energy production from biogas in Hungary 2013-2022
About the region
10
- Premium Statistic Hydropower electricity production in France 2014-2023
- Basic Statistic Electricity produced from wind power in Sweden 2013-2022
- Premium Statistic Electricity produced from wind in the Netherlands 2013-2021
- Premium Statistic Electricity production from biogas in Belgium 2015-2021
- Premium Statistic Electricity produced from wind power in Belgium 2013-2022
- Premium Statistic Electricity production from biogas in the Netherlands 2015-2021
- Basic Statistic Electricity produced from wind power in Denmark 2013-2022
- Premium Statistic Wind energy primary production in France 2015-2022
- Premium Statistic Gross electricity generation from geothermal sources in France 2013-2021
- Premium Statistic Electricity production from biogas in Denmark 2013-2020
Selected statistics
3
Other regions
9
- Premium Statistic Energy production from biogas in Denmark 2013-2022
- Basic Statistic Energy production from landfill gas in Hungary 2013-2018
- Basic Statistic Renewable energy - share of energy consumed in Iran 1990-2012
- Premium Statistic Energy production from anaerobic fermentation biogas in Luxembourg 2013-2021
- Premium Statistic Geothermal heat pumps sold in Austria 2013-2017
- Basic Statistic Geothermal heat pumps sold in Bulgaria 2013-2015
- Premium Statistic Energy production from landfill gas in Latvia 2013-2017
- Premium Statistic Energy production from anaerobic fermentation biogas in Cyprus 2013-2017
- Premium Statistic Energy production from anaerobic fermentation biogas in Slovakia 2013-2017
Related statistics
10
- Premium Statistic Energy production from biogas in Belgium 2013-2021
- Basic Statistic Energy production from biogas in Sweden 2013-2021
- Basic Statistic Energy production from biogas in Slovenia 2013-2021
- Premium Statistic Energy production from sewage sludge gas in Luxembourg 2013-2021
- Premium Statistic Electricity produced from wind power in Luxembourg 2015-2022
- Premium Statistic Energy production from anaerobic fermentation biogas in the Netherlands 2013-2021
- Premium Statistic Solar thermal surfaces installed in Belgium 2019-2022
- Premium Statistic Solar thermal surfaces installed in the Netherlands 2015-2022
- Premium Statistic Solar thermal surfaces installed in the European Union 2022, by country
- Premium Statistic Solar thermal capacity in the European Union 2022, by country
Further related statistics
10
- Biofuels related jobs worldwide by region 2019
- U.S. imports of hydraulic cement 2010-2023
- Hydropower consumption in Europe and CIS 2000-2022
- Primary energy consumption in Brazil 2009-2022
- Primary energy consumption in Germany 1998-2022
- Primary energy consumption in Asia Pacific 2022
- Primary energy consumption in South Korea 2021-2022, by fuel
- Primary energy consumption in OECD countries 2019-2022, by fuel type
- U.S. wind power generation 2009-2040
- U.S. export and import waterborne freight 2010
Further Content: You might find this interesting as well
Statistics
- Biofuels related jobs worldwide by region 2019
- U.S. imports of hydraulic cement 2010-2023
- Hydropower consumption in Europe and CIS 2000-2022
- Primary energy consumption in Brazil 2009-2022
- Primary energy consumption in Germany 1998-2022
- Primary energy consumption in Asia Pacific 2022
- Primary energy consumption in South Korea 2021-2022, by fuel
- Primary energy consumption in OECD countries 2019-2022, by fuel type
- U.S. wind power generation 2009-2040
- U.S. export and import waterborne freight 2010
EurObserv'ER. (February 27, 2018). Small hydropower net capacity in Italy from 2013 to 2016 (in megawatts) [Graph]. In Statista. Retrieved May 13, 2024, from https://www.statista.com/statistics/738170/small-hydropower-net-capacity-in-italy/
EurObserv'ER. "Small hydropower net capacity in Italy from 2013 to 2016 (in megawatts)." Chart. February 27, 2018. Statista. Accessed May 13, 2024. https://www.statista.com/statistics/738170/small-hydropower-net-capacity-in-italy/
EurObserv'ER. (2018). Small hydropower net capacity in Italy from 2013 to 2016 (in megawatts). Statista. Statista Inc.. Accessed: May 13, 2024. https://www.statista.com/statistics/738170/small-hydropower-net-capacity-in-italy/
EurObserv'ER. "Small Hydropower Net Capacity in Italy from 2013 to 2016 (in Megawatts)." Statista, Statista Inc., 27 Feb 2018, https://www.statista.com/statistics/738170/small-hydropower-net-capacity-in-italy/
EurObserv'ER, Small hydropower net capacity in Italy from 2013 to 2016 (in megawatts) Statista, https://www.statista.com/statistics/738170/small-hydropower-net-capacity-in-italy/ (last visited May 13, 2024)
Small hydropower net capacity in Italy from 2013 to 2016 (in megawatts) [Graph], EurObserv'ER, February 27, 2018. [Online]. Available: https://www.statista.com/statistics/738170/small-hydropower-net-capacity-in-italy/