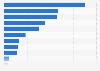
This statistic shows the forecasted change in world silver fabrication for industrial applications in 2017 compared to 2016. In 2017, the electronics industry's silver fabrication was expected to be 6.3 million ounces higher than it was in 2016.
Annual change in world silver fabrication in 2017 compared to 2016, by industrial application (in million ounces)*
Basic Account
Get to know the platform
You only have access to basic statistics.
This statistic is not included in your account.
Starter Account
The ideal entry-level account for individual users
- Instant access to 1m statistics
- Download in XLS, PDF & PNG format
- Detailed references
$199 USD / Month *
Professional Account
Full access
Business Solutions including all features.
* Prices do not include sales tax.
Other statistics that may interest you Statistics on
About the industry
8
- Premium Statistic World physical silver demand change by sector 2017
- Premium Statistic World physical silver demand change percentage by sector 2017
- Premium Statistic World silver demand annual change by industrial application 2016
- Premium Statistic Global palladium consumption distribution 2022, by industry
- Premium Statistic Global palladium consumption 2022, by industry
- Basic Statistic Silver reserves worldwide 2010-2023
- Premium Statistic Global reserves of silver 2023, by leading country
- Premium Statistic Production of silver in Canada by province 2022
About the region
10
- Basic Statistic Distribution of primary nickel consumption worldwide 2022, by industry
- Premium Statistic Primary nickel consumption worldwide by industry 2022
- Premium Statistic Nikon's profit FY 2014-2023
- Premium Statistic Nikon's revenue FY 2014-2023
- Premium Statistic Nikon's operating profit FY 2014-2023
- Premium Statistic Silicon wafer market revenue worldwide 2010-2023
- Premium Statistic Global tantalum mine production 2023, by country
- Premium Statistic Global tantalum mine production 2010-2023
- Premium Statistic Tantalum price 2012-2023
- Premium Statistic Global tungsten price 2018-2023
Selected statistics
1
Other regions
10
- Basic Statistic Net profit of Ferroglobe 2013-2022
- Premium Statistic Production volume of finished steel in India 2016-2022
- Premium Statistic Parts and accessories of photographic equipment: UK manufacturer sales 2008-2021
- Premium Statistic Hot-dip zinc-coated steel sheets production volume in Japan 2013-2022
- Premium Statistic Photographic goods wholesale trade turnover in Norway 2008-2021
- Premium Statistic Production of nickel in Canada by province 2022
- Premium Statistic Production capacities of key petrochemical products of IQ Group 2022
- Premium Statistic Production volume of zinc aluminum alloy coated steel sheet in South Korea 2006-2017
- Premium Statistic Cobalt refinery production in China 2010-2020
- Basic Statistic Installed capacity of solar PV power in Wales 2010-2022
Related statistics
10
- Premium Statistic Revenue of Ferroglobe 2011-2022
- Basic Statistic Share of ferrosilicon imports in the U.S. 2019-2022, by country of origin
- Basic Statistic Share of silicon metal imports in the U.S. 2019-2022, by country of origin
- Basic Statistic Production of silicon alloys and metals in the U.S. 2011-2022
- Premium Statistic Silicon imports to the U.S. 2016-2023, by type
- Premium Statistic Share of silicon imports in the U.S. 2019-2022, by country of origin
- Premium Statistic Production, shipments and stocks of silicon in the U.S. 2012-2022
- Basic Statistic Silicon consumption in the U.S. 2022, by end use
- Premium Statistic Production of zinc in Canada by province 2022
- Basic Statistic Production value of zinc in Canada by province 2021
Further related statistics
10
- First Solar's net income FY 2007-2023
- Rio Tinto's aluminum and copper production 2010-2023
- Number of Rio Tinto's employees 2010-2023
- Import volume of cobalt in the U.S. 2010-2023
- Comparison of cobalt consumption in the U.S. 2010-2023
- Biofuels related jobs worldwide by region 2019
- Consumer electronics: Online purchasing in Great Britain 2020, by demographic
- Consumer expenditure on photo studios in the U.S. 1999-2013
- Jenoptik: revenue in 2012, by segment
- Number of people participating in personal creativity activities in the U.S. 2010
Further Content: You might find this interesting as well
Statistics
- First Solar's net income FY 2007-2023
- Rio Tinto's aluminum and copper production 2010-2023
- Number of Rio Tinto's employees 2010-2023
- Import volume of cobalt in the U.S. 2010-2023
- Comparison of cobalt consumption in the U.S. 2010-2023
- Biofuels related jobs worldwide by region 2019
- Consumer electronics: Online purchasing in Great Britain 2020, by demographic
- Consumer expenditure on photo studios in the U.S. 1999-2013
- Jenoptik: revenue in 2012, by segment
- Number of people participating in personal creativity activities in the U.S. 2010
Statista. (November 15, 2017). Annual change in world silver fabrication in 2017 compared to 2016, by industrial application (in million ounces)* [Graph]. In Statista. Retrieved May 25, 2024, from https://www.statista.com/statistics/787735/global-silver-fabrication-annual-changes-by-industrial-application/
Statista. "Annual change in world silver fabrication in 2017 compared to 2016, by industrial application (in million ounces)*." Chart. November 15, 2017. Statista. Accessed May 25, 2024. https://www.statista.com/statistics/787735/global-silver-fabrication-annual-changes-by-industrial-application/
Statista. (2017). Annual change in world silver fabrication in 2017 compared to 2016, by industrial application (in million ounces)*. Statista. Statista Inc.. Accessed: May 25, 2024. https://www.statista.com/statistics/787735/global-silver-fabrication-annual-changes-by-industrial-application/
Statista. "Annual Change in World Silver Fabrication in 2017 Compared to 2016, by Industrial Application (in Million Ounces)*." Statista, Statista Inc., 15 Nov 2017, https://www.statista.com/statistics/787735/global-silver-fabrication-annual-changes-by-industrial-application/
Statista, Annual change in world silver fabrication in 2017 compared to 2016, by industrial application (in million ounces)* Statista, https://www.statista.com/statistics/787735/global-silver-fabrication-annual-changes-by-industrial-application/ (last visited May 25, 2024)
Annual change in world silver fabrication in 2017 compared to 2016, by industrial application (in million ounces)* [Graph], Statista, November 15, 2017. [Online]. Available: https://www.statista.com/statistics/787735/global-silver-fabrication-annual-changes-by-industrial-application/