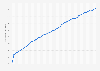
Growth rate of household care industry across India FY 2010 - FY 2020
This statistic illustrates the growth rate of household care industry across India from fiscal year 2010 to fiscal year 2020. The growth rate of household care industry across India was estimated to be 17.42 percent from fiscal year 2015 to 2020, up from about 14 percent from fiscal year 2010 to fiscal year 2015.