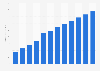
This statistic presents the number of websites selling native advertising from the fourth quarter of 2014 to the third quarter of 2017. According to the findings, in the fourth quarter approximately 356 sites were selling native advertising placements, while by the second quarter of 2016 this value reached over one thousand. As of the third quarter of 2017, 1,263 sites were selling native ad placements.
Number of websites selling native advertising from 4th quarter 2014 to 3rd quarter 2017
Basic Account
Get to know the platform
You only have access to basic statistics.
This statistic is not included in your account.
Starter Account
The ideal entry-level account for individual users
- Instant access to 1m statistics
- Download in XLS, PDF & PNG format
- Detailed references
$199 USD / Month *
Professional Account
Full access
Business Solutions including all features.
* Prices do not include sales tax.
Other statistics that may interest you Statistics on
About the industry
10
- Premium Statistic Broadcast media advertising spending in Finland 2022, by medium
- Premium Statistic Digital programmatic advertising market in Italy 2017-2019
- Premium Statistic Online advertising spending in Finland 2012-2022
- Premium Statistic Advertising spending change in Finland 2022, by medium
- Premium Statistic Digital ad spend growth in the Netherlands 2022, by format
- Premium Statistic AdTech companies - revenues 2022
- Premium Statistic Online advertising revenue in Denmark 2009-2020
- Premium Statistic Gen Z attitudes to online advertising in the UK in 2023
- Premium Statistic Ranking of the best agencies in digital creation in Germany 2021
- Premium Statistic Search ad spend growth in France 2020-2023
About the region
10
- Premium Statistic Media companies: ad revenues 2022
- Premium Statistic Share of digital in global ad spend 2021-2026
- Premium Statistic AdTech: number of M&A deals worldwide 2020-2022
- Premium Statistic Growth of global advertising expenditure 2015-2022, by region
- Premium Statistic Advertising expenditure growth in selected markets 2015-2022
- Premium Statistic Leading Amazon Prime day promotion types retailers invest in worldwide 2020
- Premium Statistic Growth of global advertising revenues 2015-2019, by medium
- Premium Statistic Paid digital ad channels used in selected industries worldwide 2018
- Premium Statistic Advertising spending worldwide 2024, by region
- Basic Statistic YouTube: global advertising revenues as of Q4 2023
Selected statistics
1
Other regions
9
- Premium Statistic Advertising revenue in Norway 2017, by activities
- Premium Statistic Italy: Millennials' opinion on the influence of advertising 2016, by source
- Premium Statistic Sponsored content share on YouTube in Russian 2018-2020
- Premium Statistic Mobile ad spend per mobile internet user in the Middle East & Africa 2013-2018
- Premium Statistic Advertising market size Hong Kong 2011-2020
- Premium Statistic Market volume of online advertising in Switzerland 2006-2017, by segment
- Premium Statistic Ad spend of leading companies in Australia 2017
- Premium Statistic Brazil: McDonald's advertising spending 2017-2018
- Premium Statistic Coronavirus impact on online advertising spend in the UK in 2020, by quarter
Related statistics
10
- Premium Statistic Opinions on online advertising relevance in the U.S. 2019-2023
- Premium Statistic Advertising spending in Sweden 2018-2022
- Premium Statistic Ad market growth in the Nordics 2020-2022
- Premium Statistic Advertising revenue in Norway 2023-2024
- Basic Statistic Advertising spending in Iceland 2009-2022
- Basic Statistic Outdoor advertising revenue in Iceland 2008-2022
- Premium Statistic Distribution of advertising revenue in Iceland 2022, by medium
- Basic Statistic Online media advertising revenue in Iceland 1998-2022
- Premium Statistic Radio advertising spending in Norway from 2009-2022
- Premium Statistic Cinema advertising spending in Norway 2009-2022
Further Content: You might find this interesting as well
Statistics
MediaRadar. (November 22, 2017). Number of websites selling native advertising from 4th quarter 2014 to 3rd quarter 2017 [Graph]. In Statista. Retrieved May 13, 2024, from https://www.statista.com/statistics/891179/number-sites-selling-native-advertising/
MediaRadar. "Number of websites selling native advertising from 4th quarter 2014 to 3rd quarter 2017." Chart. November 22, 2017. Statista. Accessed May 13, 2024. https://www.statista.com/statistics/891179/number-sites-selling-native-advertising/
MediaRadar. (2017). Number of websites selling native advertising from 4th quarter 2014 to 3rd quarter 2017. Statista. Statista Inc.. Accessed: May 13, 2024. https://www.statista.com/statistics/891179/number-sites-selling-native-advertising/
MediaRadar. "Number of Websites Selling Native Advertising from 4th Quarter 2014 to 3rd Quarter 2017." Statista, Statista Inc., 22 Nov 2017, https://www.statista.com/statistics/891179/number-sites-selling-native-advertising/
MediaRadar, Number of websites selling native advertising from 4th quarter 2014 to 3rd quarter 2017 Statista, https://www.statista.com/statistics/891179/number-sites-selling-native-advertising/ (last visited May 13, 2024)
Number of websites selling native advertising from 4th quarter 2014 to 3rd quarter 2017 [Graph], MediaRadar, November 22, 2017. [Online]. Available: https://www.statista.com/statistics/891179/number-sites-selling-native-advertising/