It seems that age is not a major factor in whether people in the U.S. trust their government, with between 17 and 28 percent of all generations reporting they trust the government always or most of the time in an April 2021 survey. This compares to around 50 percent of all generations in a survey conducted in October 1972.
Share of people in the United States who trust the government always or most of the time from 1972 to 2021, by generation
Basic Account
Get to know the platform
You only have access to basic statistics.
This statistic is not included in your account.
Starter Account
The ideal entry-level account for individual users
- Instant access to 1m statistics
- Download in XLS, PDF & PNG format
- Detailed references
$199 USD / Month *
Professional Account
Full access
Business Solutions including all features.
* Prices do not include sales tax.
Other statistics that may interest you Generation gap in the U.S.
Overview
3
Demographics
4
Income and employment
7
- Premium Statistic U.S. average earnings in the U.S. 2022, by age
- Basic Statistic U.S. gender pay gap by age group Q4 2023
- Premium Statistic U.S. number of minimum wage workers 2022, by age
- Basic Statistic U.S. percentage distribution of low wage workers 2022, by age
- Basic Statistic U.S. unemployment rate by age 1990-2023
- Basic Statistic U.S. long-term unemployment rate in 2022, by age
- Premium Statistic U.S. number of retired Social Security beneficiaries 2022, by age
Costs and budgets
5
- Basic Statistic Average annual charges for higher education in the U.S. 1970-2022
- Basic Statistic Average debt of university graduates in the U.S. 2008-2022
- Premium Statistic Homeownership expectations of adults in the United States in 2020, by generation
- Premium Statistic COVID-19 effect on U.S. homeownership plans 2020, by generation
- Premium Statistic Estimated cost of life insurance in the U.S. 2020, by generation
Opinions
4
- Premium Statistic Leading economic concerns in the United States as of June 2021, by generation
- Premium Statistic U.S. views on same-sex marriage by generation 2001-2019
- Premium Statistic 
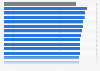
U.S. trust in government 1972-2021, by generation
- Basic Statistic U.S. adults on whether billionaires are a good or bad thing 2021, by age
Further related statistics
19
- U.S. trust in government 1972-2023, by race
- Opinions on women having a better life than their parents' generation India 2019
- Mexico: consumer expenditure 2017, by channel & generation
- Willingness to purchase a gift without a discount U.S. by generation 2017
- Colombia: consumer expenditure 2017, by channel & generation
- Share of home sellers who renovated in the U.S. 2019, by generation
- Chile: consumer expenditure 2017, by channel & generation
- Home renovators in the U.S. 2023, by generation
- Lasting impact of Kurt Cobain's music/work in the U.S. 2019, by generation
- Share of homeowners planning to sell their home soon in the U.S. 2019, by generation
- Household expenditure in Chile in 2017, by age household head
- Size of down payment home buyers put down in the U.S. 2019, by generation
- U.S. consumers' importance of saturated fat when buying groceries by generation 2014
- U.S. consumers' importance of frozen when buying groceries by generation 2014
- North American sodium dichromate market value 2018 & 2023
- Consumer price index of athletic footwear in Canada 2003-2022
- Specialized storage and warehousing businesses in the U.S. 2018-2021
- Refrigeration condensing units: U.S. shipment value 2007-2016
- Number of visitors to Kejimkujik National Park in Canada 2011-2023
Further Content: You might find this interesting as well
Statistics
- U.S. trust in government 1972-2023, by race
- Opinions on women having a better life than their parents' generation India 2019
- Mexico: consumer expenditure 2017, by channel & generation
- Willingness to purchase a gift without a discount U.S. by generation 2017
- Colombia: consumer expenditure 2017, by channel & generation
- Share of home sellers who renovated in the U.S. 2019, by generation
- Chile: consumer expenditure 2017, by channel & generation
- Home renovators in the U.S. 2023, by generation
- Lasting impact of Kurt Cobain's music/work in the U.S. 2019, by generation
- Share of homeowners planning to sell their home soon in the U.S. 2019, by generation
- Household expenditure in Chile in 2017, by age household head
- Size of down payment home buyers put down in the U.S. 2019, by generation
- U.S. consumers' importance of saturated fat when buying groceries by generation 2014
- U.S. consumers' importance of frozen when buying groceries by generation 2014
- North American sodium dichromate market value 2018 & 2023
- Consumer price index of athletic footwear in Canada 2003-2022
- Specialized storage and warehousing businesses in the U.S. 2018-2021
- Refrigeration condensing units: U.S. shipment value 2007-2016
- Number of visitors to Kejimkujik National Park in Canada 2011-2023
Pew Research Center. (April 10, 2021). Share of people in the United States who trust the government always or most of the time from 1972 to 2021, by generation [Graph]. In Statista. Retrieved May 15, 2024, from https://www.statista.com/statistics/1078192/trust-government-generation-us/
Pew Research Center. "Share of people in the United States who trust the government always or most of the time from 1972 to 2021, by generation." Chart. April 10, 2021. Statista. Accessed May 15, 2024. https://www.statista.com/statistics/1078192/trust-government-generation-us/
Pew Research Center. (2021). Share of people in the United States who trust the government always or most of the time from 1972 to 2021, by generation. Statista. Statista Inc.. Accessed: May 15, 2024. https://www.statista.com/statistics/1078192/trust-government-generation-us/
Pew Research Center. "Share of People in The United States Who Trust The Government Always or Most of The Time from 1972 to 2021, by Generation." Statista, Statista Inc., 10 Apr 2021, https://www.statista.com/statistics/1078192/trust-government-generation-us/
Pew Research Center, Share of people in the United States who trust the government always or most of the time from 1972 to 2021, by generation Statista, https://www.statista.com/statistics/1078192/trust-government-generation-us/ (last visited May 15, 2024)
Share of people in the United States who trust the government always or most of the time from 1972 to 2021, by generation [Graph], Pew Research Center, April 10, 2021. [Online]. Available: https://www.statista.com/statistics/1078192/trust-government-generation-us/