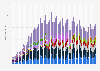
Total mobile payment usage in Taiwan 2017-2023

Mobile payment penetration rate in Taiwan from 2017 to 2023

Download
Show detailed source information?
Register for free
Already a member?
Log in
Source

Use Ask Statista Research Service

Release date

August 2023

Region

Taiwan

Survey time period

May 2 to 20, 2023

Number of respondents

1,084 respondents

Age group

18 years and older

Special properties

in 6 municipalities and 16 cities/counties in Taiwan

Method of interview

Computer-assisted telephone interviews (CATI)

Supplementary notes

The survey collected different information through landline survey, mobile survey, Internet survey, and in depth interviews.

Survey was conducted among 2,244 respondents in 2017, 2,535 respondents in 2018, 1,903 respondents in 2019, 2,209 respondents in 2020, and 2,228 respondents in 2022.
Surveys in previous years were conducted among respondents aged 12 years and older.

Citation formats
Statista Accounts: Access All Statistics. Starting from $2,388 USD / Year
Basic Account
Get to know the platform

You only have access to basic statistics.
This statistic is not included in your account.

Starter Account
The ideal entry-level account for individual users
  • Instant access to 1m statistics
  • Download in XLS, PDF & PNG format
  • Detailed references
$199 USD / Month *
Professional Account
Full access

Business Solutions including all features.

* Prices do not include sales tax.

Statistics on " Smartphone market in Taiwan "

Other statistics that may interest you Smartphone market in Taiwan

Overview

5

Brands

6

Trade

4

Smartphone usage

5

Mobile internet and 5G

5

Mobile payments

4

Further related statistics

18
Statista Accounts: Access All Statistics. Starting from $2,388 USD / Year
Learn more about how Statista can support your business.